Author: Emmanuel ANNEREL, Prof. dr. ir.-arch., Promat Research and Technology Centre; Magnel Laboratory for Concrete Research, Ghent University, Technologiepark-Zwijnaarde 904, B-9052, Ghent
Co-author 1: Kees BOTH, Dr.ir., MSFPE, MIFireE, Promat
Co-author 2: Tony LEMAIRE, Efectis Netherlands
Presented at: ITA WTC 2015 Congress and 41st General Assembly, May 22-28, 2015, Lacroma Valamar Congress Center, Dubrovnik, Croatia
Topic Fire Safety of Tunnels and Underground Structures
The structural integrity and resilience of tunnel linings are enhanced with passive fire protection systems, using boards or spray mortar. When assessing the performance of these systems, fully developed fires are assumed, and the passive fire protection prevents the load bearing structure to prematurely loose strength and stiffness during the fire incident, as well as mitigates structural damage, including severe cracking in case of concrete tunnel linings. As such passive fire protection contributes to life safety, allowing evacuees to safely egress the hostile environment, and emergency response teams to safely intervene, but it also provides inspection, investigation and repair workers a reliable working environment.
However, passive fire protection also contributes to life safety in earlier stage of fire development. Research reveals that passive fire protection systems using boards or spray mortars may indeed contribute to tenability, by providing higher probability of stratification, over longer distances and for longer time periods, allowing evacuees more opportunities and time to safely find there way to (emergency) exits.
This paper presents results from advanced studies, using sophisticated (CFD) computer simulations. In particular, fire scenarios involving a car and a HGV truck have been studied, with varying (longitudinal) ventilation conditions. The influence on life safety conditions is discussed in terms of temperature, visibility and the radiation level, all as a function of the distance from the fire, with a view to assess the risk to evacuees and fire spread (ignition of other vehicles).
1. Introduction
The positive effect of passive fire protection – namely protecting the tunnel lining with boards or mortars to prevent the tunnel from severe structural damage during the fire and to maintain sufficient durability after the fire - has been proved in many severe tunnel fire accidents in the past. Tunnels are a vital and vulnerable point of the transportation networks global wide. In case of an accident and closure of the tunnel, for instance for repair work due to losses of durability or structural loadbearing capacity, the socio-economical impact would be rather enormous.
However, in this paper, it is studied in which way the use of passive fire protection in tunnel linings can also contribute to life safety conditions. This positive hypothesis is based upon observations of the BENELUX fire tests (see Fig. 1), where a tunnel provided by passive fire protection at the ceiling, shows the existence of a stratified smoke layer over a very long distance [1, 2, 3]. It was expected that this stratification would not stand that long due to cooling down of the hot air. It is clear that from a life safety point of view, the existence of such a stratified smoke layer has important advantages.
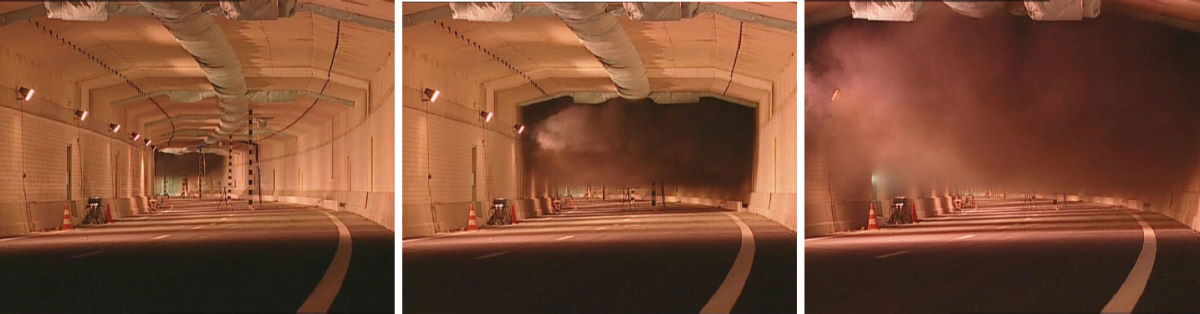
Fig. 1 Stratification of smoke layer in BENELUX fire tests. (from left to right: observations at 50s, 150s, 180s) [1,2,3]
In this paper, the effect of passive fire protection to tenability conditions is studied for a 200m long tunnel with a car or truck fire near the tunnel entrance by means of FDS (FDS v5 and Smokeview v5 are used). Those fire scenario’s should be related to the occurrence of a fire at the back of a traffic jams inside the tunnel. For those cases, but not exclusively, the existence of a stratified smoke layer is of high importance when related to evacuation possibilities.
2. Life safety limits criteria
In [4, 5], life safety limits can be found for evacuation of occupants. Table 1 summarizes the limits criteria that are further used in this paper. A distinction can be made between tenability limits, namely temperature and radiation, and the other life safety limits, such as visibility. Toxicity is not studied in this paper.
Table 1. Life safety limits criteria
| Temperature | 60°C; 120°C (> 60s : skin/lungs affected); 190°C (< 60 s : skin/lungs affected) |
| Radiation | 2.5 kW/m² |
| Visibility | 10 m |
3. Test cases
3.1 Tunnel configuration
The studied tunnel is one-directional with a length of 200 m and a cross section of 8 m width x 5.2m height. In order to simulate correct boundary conditions, control volumes with open flow surfaces are added to the model at the entrance and exit of the tunnel. To study the effect of longitudinal ventilation inside the tunnel, ventilation rates of 0 and 3 m/s are introduced at the entrance of the tunnel. It is noted that according to [6], 3 m/s is already a high velocity, as 2-3 m/s is expected to avoid backlayering for HGV fires.
3.2 Fire
Two fire scenario’s were studied in separate simulations, namely a small 6 MW car fire and a heavy 200 MW HGV truck fire.
The car has dimensions 4 m length, 1.7 m width and 1 m height, whereas the truck measures 20m length, 2.5 m width and 4 m height. The distance between both vehicles and the tunnel wall is 0.5 m. The centre of both vehicles is positioned at 20 m from the tunnel entrance. There are no other vehicles positioned in the tunnel.
The fire is configured on top of the vehicles. The HRR curve starts at simulation time of 5 seconds, from which it builds up linearly to full capacity at 20 seconds, where it is held constant at a value of 882.35 W/m² for the car fire and 4000 W/m² for the truck fire till the end of simulation time of 600 seconds. The analysis is done on the simulation results in the range 180-252 seconds, at which steady state conditions were achieved and time period when efficient evacuation of occupants is of most importance.
Figure 2 shows the gas temperatures at 20 cm from the tunnel ceiling. The position of the vehicles is indicated by a grey box. It is noted that in case of the 200 MW fire, temperatures above 400°C are obtained over almost the whole tunnel length. Assuming that the surface temperature will be close to the calculated ceiling temperature, it can be understood that measures, such as a passive fire protection, are necessary to prevent the structure from fire damage (2008-Efectis-R0695: RWS test procedure: concrete surface temperature should be < 380°C).
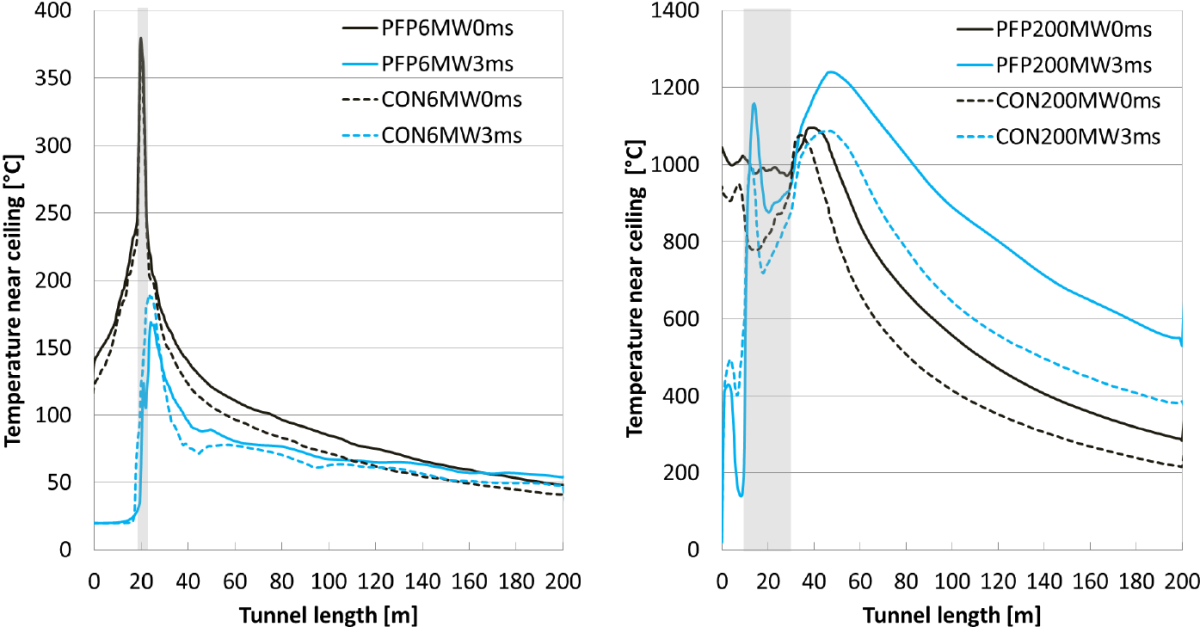
Fig. 2 Temperatures near tunnel ceiling for 6 MW fire (left) and 200 MW fire (right). Both for ventilation rates 0 and 3 m/s, and protected (PFP) and unprotected (CON) conditions.
Notice that in a real fire, the onset of the fire is not always at 4 m, but at for instance 1 m when the cargo burns away. Hence, the studied fire is a worst case from the point of view of damage to the structure, and can be interpreted as a consequence of collision of the truck with other cars resulting in an upward and turned position of the truck in the tunnel. On the other hand, it can be expected that such a collision will result in a larger HRR as more vehicles are involved and the position of the fire can be altered (over a larger area; not along the length of the wall). These aspects are not incorporated in the present study.
3.3 Mesh size
Preliminary studies showed the need for a mesh size of 10 cm to be used in the vicinity of the fire to obtain realistic temperatures. Initially, the mesh size was increased beyond half length of the tunnel length to 20 cm to decrease the calculation time. However, to overcome numerical instabilities, a uniform mesh size of 10 cm was required in some cases.
3.4 Material boundaries
For the lining of the tunnel, 2 situations are studied: 1) unprotected tunnel consisting of 0.6 m thick concrete walls, and 2) fire protected tunnel consisting of 0.6 m concrete walls with coverage of 0.03 m fire insulation at the tunnel interior (the floor is in concrete).
Table 2 presents those tunnel boundary configurations, whereas Table 3 gives the used material properties, for which values at ambient condition are used, without temperature dependency.
Table 2. Material used at the tunnel boundaries
| Boundary | Unprotected tunnel | Protected tunnel |
| Floor | 0.6 m concrete | 0.6 m concrete |
| Walls | 0.6 m concrete | 0.03 m fire protection + 0.6 m concrete |
| Ceiling | 0.6 m concrete | 0.03 m fire protection + 0.6 m concrete |
Table 3. Material properties (No temperature dependency)
| Material property* | Concrete | Fire protection |
| Conductivity [W/mK] | 1 | 0.2 |
| Specific heat [kJ/kgK] | 0.88 | 1 |
| Density [kg/m³] | 2500 | 870 |
3.5 Limitations of the study
It is important to understand the simplifications and assumptions of the study:
- A constant HRR is used, instead of a natural fire development behaviour;
- The analysis is based on the average values of 180-252s. This period is very limited with respect to a full fire of several hours;
- Constant thermal properties are used, whereas in reality the conductivity will drop as function of time. According to EN1992-1-2, the concrete conductivity drops from 1.4 W/mK at 20°C to about 0.6 W/mK at 1200°C (lower limit). On the other hand, for insulation materials this drop is not the case, instead the conductivity can even increase. Hence, it can be concluded that the ‘heat sink property’ (relatively compared to insulation materials) of the concrete, which will drop in time, is not taken accurately into account.
- All concrete walls and ceiling are fire protected, whereas in reality in most cases only the ceiling is fire protected.
In reality, the differences found between protected and unprotected - when taking the material properties as function of temperature and for a fire exposure of several hours - can be expected to be smaller. The impact of the used simplifications on the simulation results and conclusions of this report is not studied.
4. Results of the 6 MW car fire
Note: all presented results are taken at the center line of the vehicles, which is at 1.5 m from the wall, and at an evacuees height of 1.5 m.
4.1 Gas temperature at 1.5 m height
Figure 3 shows the gas temperatures for the 6 MW car fire along the length of the tunnel and at a height of 1.5 m. There is no difference between protected and unprotected for 0 m/s. Also for 3m/s, no significant differences can be found, only some displacement of peaks. Except above the fire, the temperatures in the tunnel are lower than the critical tenability temperature of 60°C.
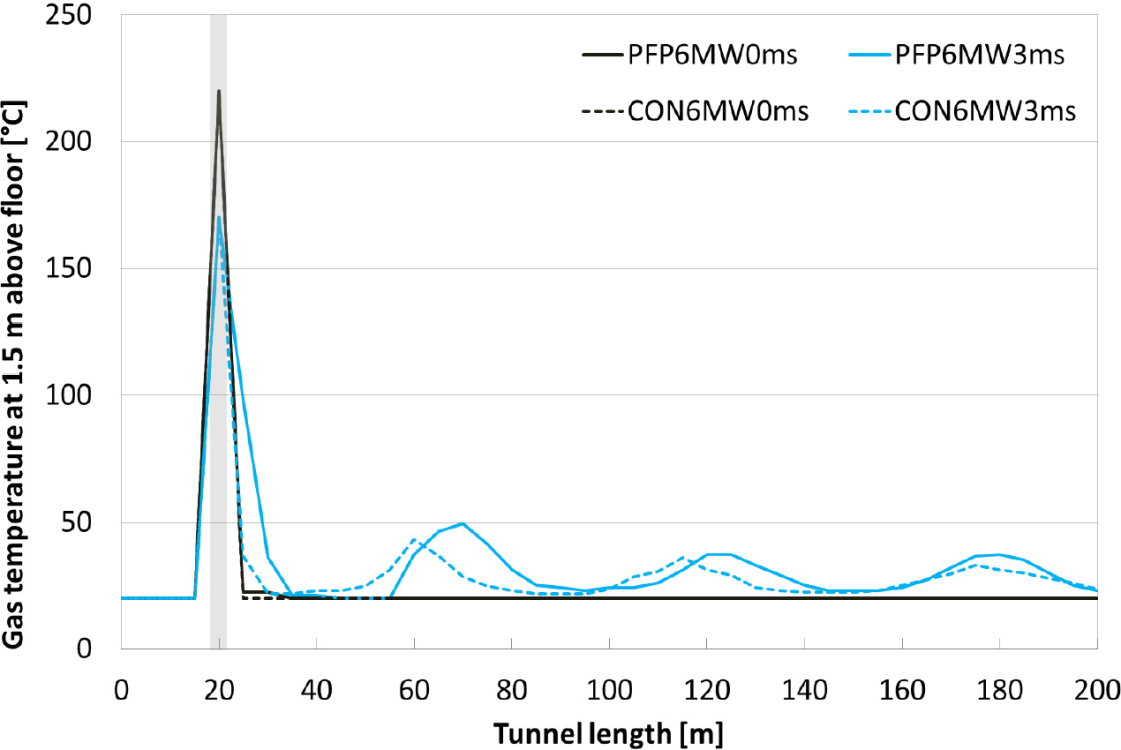
Fig. 3 Gas temperature along the tunnel length for the 6 MW fire, at height of 1.5 m.
4.2 Visibility
For 0 m/s, visibility in the tunnel is not a problem as the temperatures at evacuees height (1.5 m) remain very low. There is no significant difference between the protected and unprotected situation.
For 3 m/s, the limit criterion of 10 m is also achieved in the tunnel, except locally where temperature peaks to 40-50°C are found (see Fig. 3). Local minimum values for visibility towards light emitting signs of 4.5 and 5.7 are then found for respectively the protected and unprotected tunnel, and 2.4 and 2.9 m for visibility towards light reflecting signs (for calculation method: see section 5.2).
4.3 Radiative heat flux at 1.5 m height
Generally, very local peak values are observed, from where a steep drop is found to radiation values of < 0.5 kW/m², well beyond the critical tenability value of 2.5 kW/m² (Fig. 4). No significant differences can be found between protected and unprotected conditions.
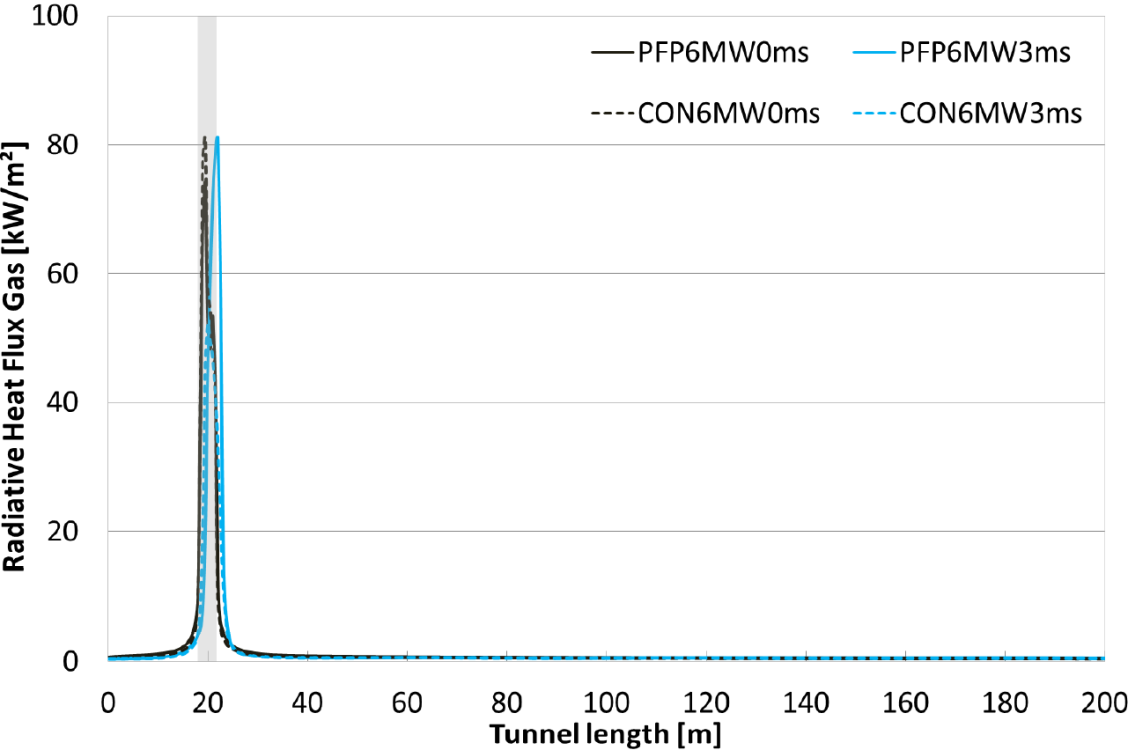
Fig. 4 Radiative heat flux received along the tunnel length for the 6 MW fire, at height of 1.5 m.
5. Results of the 200 MW truck fire
Note: all presented results are taking at the centre line of the vehicles, which is at 1.5 m from the wall, and at an evacuees height of 1.5 m. The values are zero between 10 and 30 m as the measuring points are then located inside the truck volume (indicated by a grey box).
6.5.1 Gas temperature at 1.5 m height
Figure 5 shows the temperatures at 1.5 m height. It is clear that for the situation of 3 m/s ventilation, the tenability criteria are exceeded in the tunnel, for both protected and unprotected situation.
Also for 0 m/s, the temperatures are mostly still too high for the unprotected tunnel. On the other hand, for the case of 0 m/s, the protected tunnel shows the best tenability conditions with respect to temperature. Table 4 summarizes the distances in the tunnel at which the different tenability limit criteria are met.
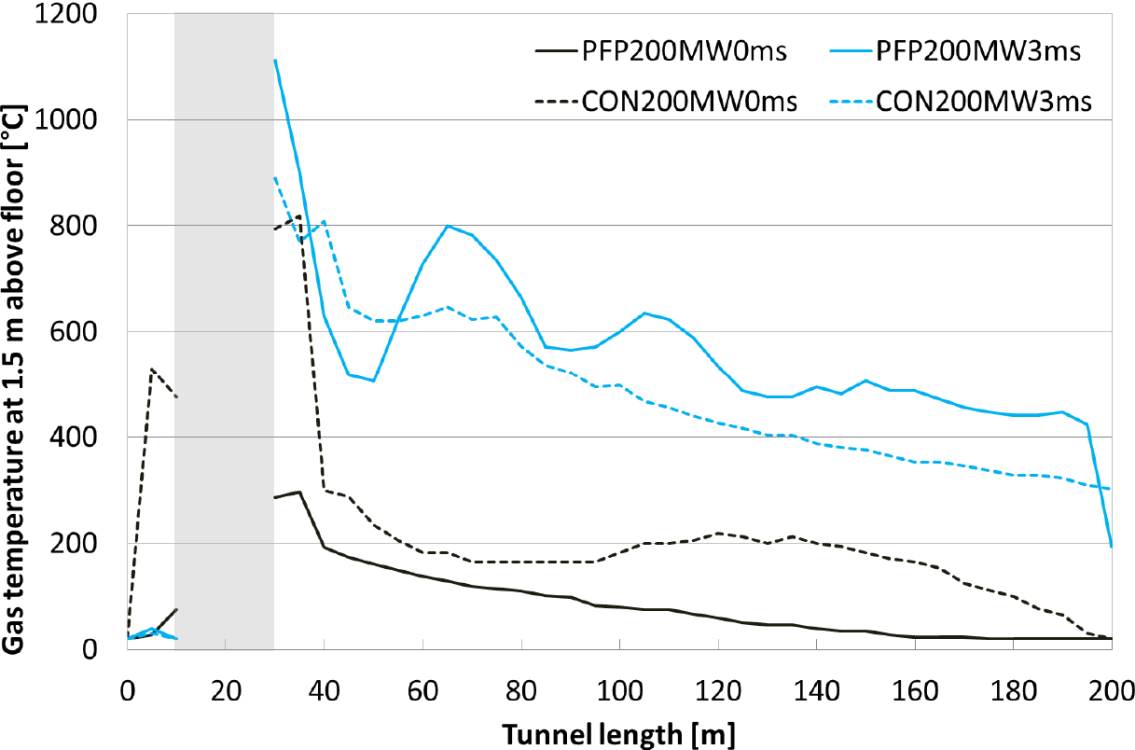
Fig. 5 Gas temperature along the tunnel length for the 200 MW fire, at height of 1.5 m.
Table 4. Distance in the tunnel at which the tenability limit criteria are achieved for the case of 0m/s ventilation
| < 60°C | < 120°C | < 190°C | |
| Protected (PFP200MW0ms) | 120 m | 70 m | 45 m |
| Unprotected (CON200MW0ms) | 195 m | 175 m | 150 m |
From this study, the positive contribution of passive fire protection on improved tenability conditions is clear, resulting in additional evacuation distances compared to the unprotected tunnel of 75 m for the limit of < 60°C, 105 m for < 120°C and 105 m for < 190°C (see Table 4). This positive contribution must be attributed to a higher ceiling temperature (see Fig. 2) as heat loss through the protected ceiling and walls is less, resulting in a stratified smoke layer for a longer distance and expected time. The existence of a higher probability of a stratified smoke layer can also be seen in Figure 9, and is also addressed in next section about visibility. In this way, it confirms the positive hypotheses of this paper, based upon observations of real scale experiments in the BENELUX-tunnel. Another conclusion is the loss of tenability condition when the ventilation is turned on. From this point of view, it should be questioned in which situations ventilation as an evacuation or fire fighting technique could be used. Situations with no or very limited ventilation can be found for short not forced ventilated tunnels, in some parts of ventilated tunnels or at the beginning of a fire at the time when the smoke extraction ventilation still needs to be started.
5.2 Visibility
A conservative estimation of the visibility distance is calculated from the gas temperature based on the similarity between the transport equations that solve the gas temperature and the mass fraction of soot [7, 8]. The estimation is conservative, because of the loss of heat to the walls. The visbility V (m) is calculated from the optical density OD (1/m) with V = K/ OD, with K = 1.3 for a light reflecting sign and 2.5 for a light emitting sign. The calculated visibility V depends on the product of mass optical density Dmass and heat of combustion Hcomb. Here a conservative value of Dmass = 400 m²/kg is used and Hcomb = 25 MJ/kg.
Figures 6 and 7 show the visibility at 1.5 m height, respectively when observing light emitting signs and light reflecting signs. For both figures, again a clear distinction is found between the situation of 0 m/s and 3 m/s. For 3 m/s, no significant difference is observed between the protected and unprotected tunnel. On the other hand, for 0 m/s, it is clear that the use of passive fire protection enhances the visibility extremely.
The visibility criterion of 10 m is nowhere obtained when ventilation is on (3 m/s). Also in case there is no forced ventilation (0 m/s), it is hard to achieve this criterion. For the protected tunnel the criterion is obtained at 153 and 157 m, respectively for visibility towards light emitting and light reflecting signs. On the other hand, for the unprotected tunnel, the criterion is only reached near the tunnel exit, respectively at 195 and 198 m. This confirms the positive contribution of passive fire protection on life safety in tunnels.
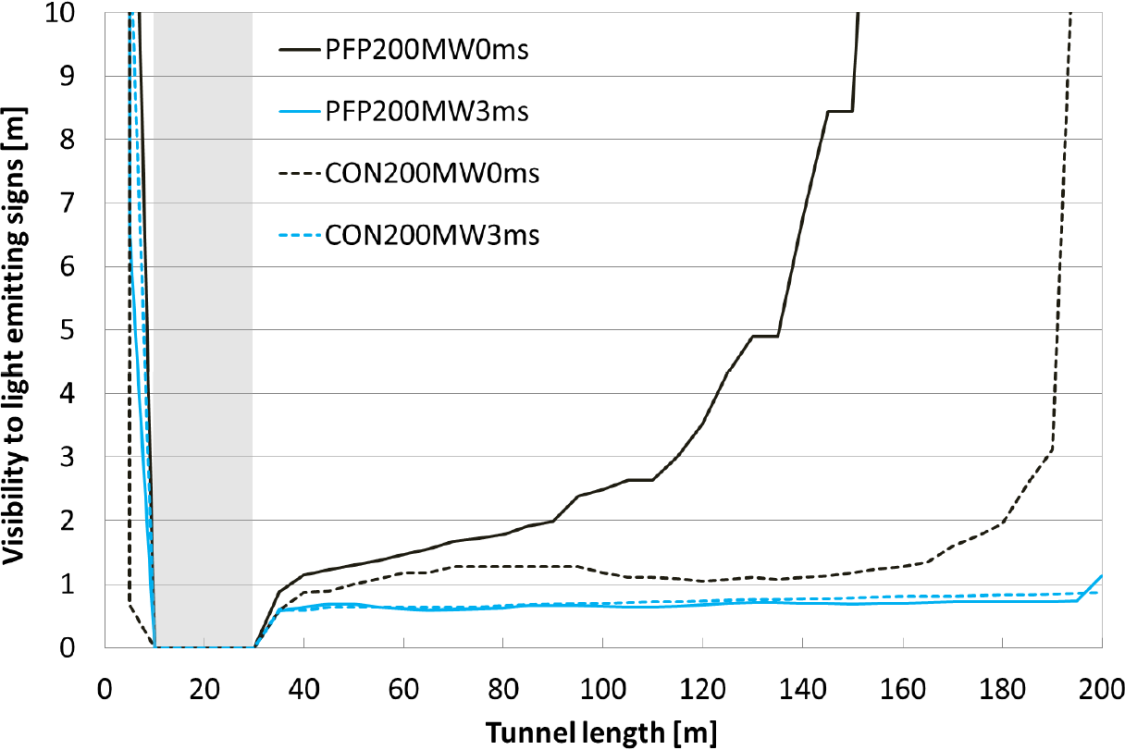
Fig. 6 Visibility to light emitting signs along the tunnel length for the 200 MW fire, at 1.5 m height.
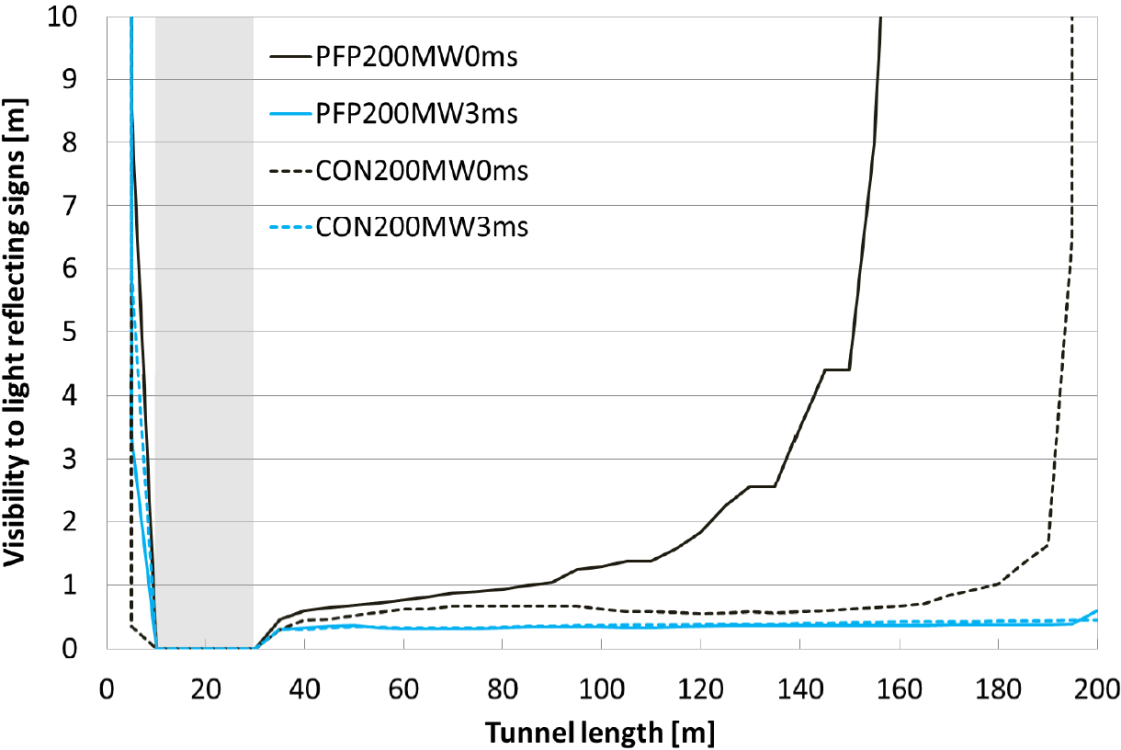
Fig. 7 Visibility to light reflecting signs along the tunnel length for the 200 MW fire, at 1.5 m height.
5.3 Radiative heat flux at 1.5 m height
Figure 8 shows the radiation received in measuring points positioned at an evacuees height of 1.5m along the length of the tunnel. Generally, peak values of the received radiation can be found near the fire, from where the values gradually drop. For test case 0 m/s, the peak value drops much faster for the unprotected tunnel than for the protected tunnel. For test cases 3 m/s, a pronounced wave pattern is visible and the values remain high for almost the whole tunnel.
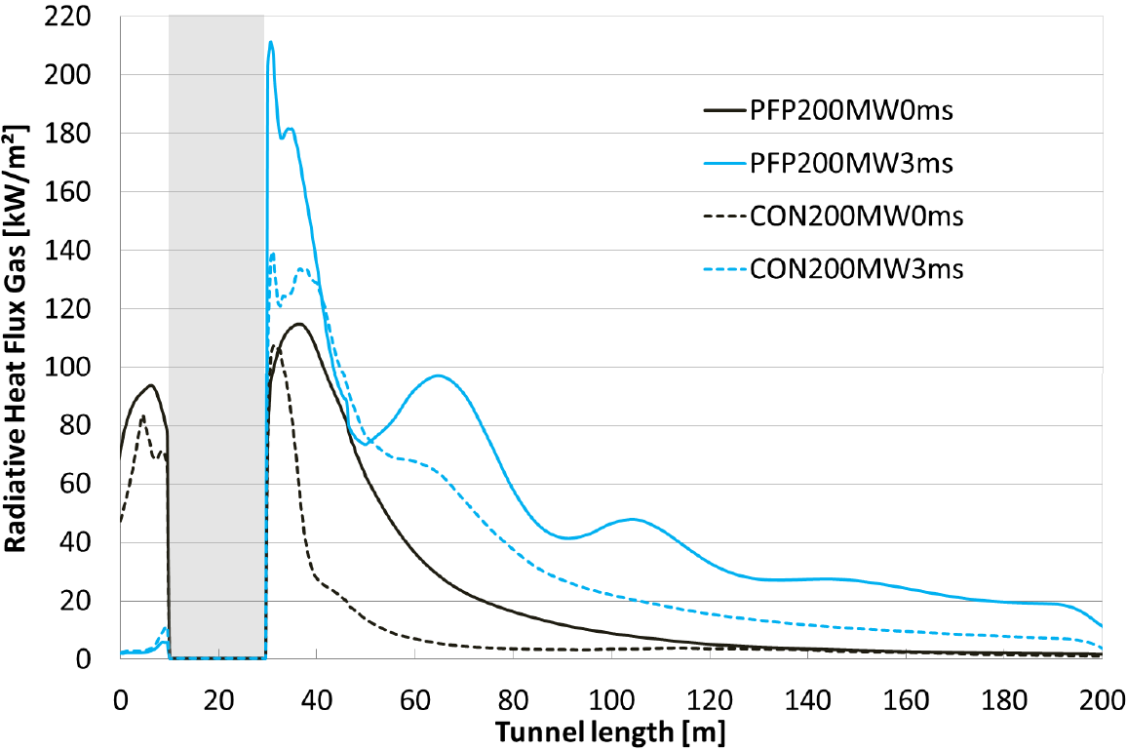
Fig. 8 Radiative heat flux received at a height of 1.5 m and along the tunnel length
The tenability criterion of 2.5 kW/m² is met for a ventilation rate of 0 m/s, but only at a distance of 160 m and 170 m for respectively unprotected and protected tunnel. This difference is not significant as with an assumed average evacuation speed of 1.2 m/s [4, 5] and 0.47 m/s [4] for disabled persons, the 10 m means about 8 seconds, respectively 21 seconds of additional required evacuation time. From a tenability point of view, evacuees should be able to find the emergency routes as fast as possible, especially for the first 170 m.
When adopting ventilation at a rate of 3 m/s, for both the protected and unprotected tunnel, the tenability criterion of 2.5 kW/m² is exceeded inside the 200 m tunnel length.
The studied fire is positioned on top of the truck, at a surface of 20 m x 2.5 m and at a height of 4 m. It is observed, however not illustrated in this paper, that even under these conditions very large radiative heat fluxes in the range of 15-105 kW/m² are received near the walls. This may open the discussion about the need for fire protection of the walls.
6. Discussion on fire spread
According to [9], fire spread between vehicles can be estimated by evaluation of whether or notthe exposed surface would attain a critical ignition temperature. This critical temperature, Tcr, can be assessed as 600°C for radiant exposure and 500°C for convective exposure for the case of spontaneous ignition, whereas it is approximated to respectively 300-410°C and 450°C in the case of piloted ignition. Further, the critical radiation for most materials is in the range of 12-22 kW/m², which corresponds to a critical temperature (at ignition, Tcr is assumed to be the same as the gas temperature) of 407-517°C.
Assessing the risk of fire spread, the criteria of < 12 kW/m² and < 407°C gas temperature obtained at 1.5 m height (~ height of a car) will be used in this paper. For the 6 MW fire, the temperature criterion is not exceeded for both protected and unprotected tunnels, and both 0 and 3 m/s (see Fig. 3). Also the radiation criterion, apart from maximum 1.5 m in the vicinity of the fire, is not exceeded in all simulated conditions (see Fig. 4).
For the 200 MW fire, the temperature criterion is satisfied for both the protected and unprotected cases for a ventilation rate of 0 m/s, but for the unprotected tunnel only at distances larger than 40 m inside the tunnel (~10 m from end of the fire) (see Fig. 5). For 3 m/s ventilation rate, this temperature criterion is only reached for distances larger than 130 m for the unprotected tunnel. For the protected tunnel, the criterion is exceeded over the whole length of the tunnel. It is clear that ventilation results, with respect to no ventilation, in bad conditions regarding fire spread.
When looking at the received radiative flux (Fig. 8), for the condition of 0 m/s, the limit is obtained at 55 m (~ 25 from end of the fire) and 90 m (~ 60 m from end of the fire) inside the tunnel for respectively the unprotected and the protected tunnel. For 3 m/s, the limit is reached at distances in the tunnel, respectively larger than 140 m (~ 110 m from end of the fire) and outside the tunnel. Again, it is clear that ventilation does not influence the fire spread in a positive way. It is also noticeable, that although for 0 m/s, the visibility (Figs. 6-7) and the temperature are the best over the whole tunnel length for the protected tunnel, this positive effect is not found for the radiative flux.
The heat flux to the vehicle at a given position from the fire can also be estimated with equation 1, as mentioned in [9].

With:
hc - average convective heat transfer coefficient to the walls [kW/m²K]
Tavg - average gas temperature over the entire cross-section at actual position [K]
Ta - ambient air temperature [K]
σ - Stefan-Boltzmann constant 5.6 x 10⁻¹¹ [kW/m²K4]
Figure 9 illustrates, for a ventilation rate of 0 m/s, the temperatures over the height of the tunnel at 50, 100 and 150 m inside the tunnel for both the protected and unprotected case. The temperatures for the unprotected tunnel increase almost linearly with the height. On the other hand, for the protected tunnel, a clear distinction can be detected of a hot upper layer and a cold bottom layer. The switch-over point is located at about 2.5 m, which is about half height of the tunnel and results in a stratified smoke layer.
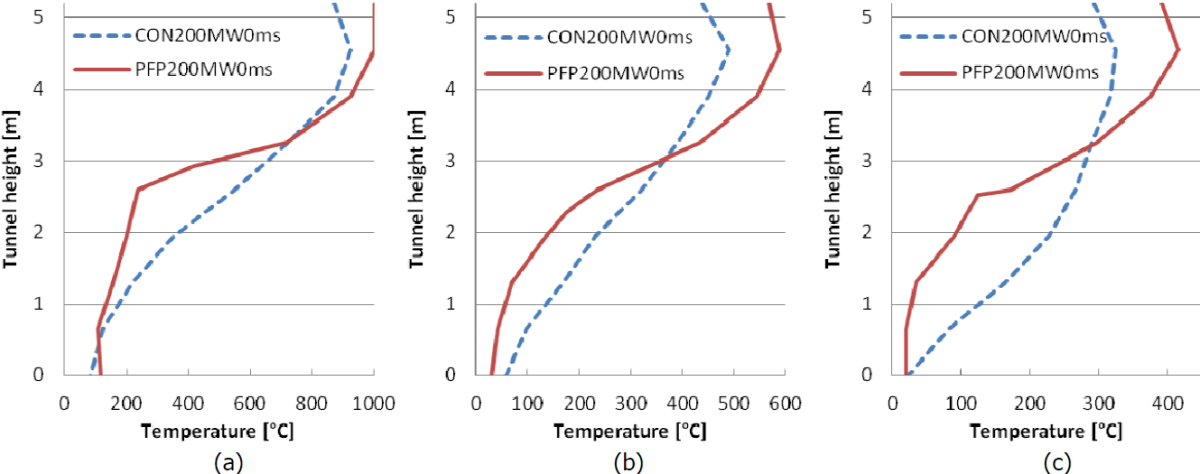
Fig. 9 Temperatures over the height of the tunnel at distances (a) 50 m, (b) 100 m and (c) 150 m inside the tunnel, for the case of 0 m/s and for both protected and unprotected condition.
The temperatures of Figure 9 are considered at 1.5 m from the tunnel wall, which is the center line of the truck. When assuming that the temperature at each height is representative for the whole width of the tunnel, Tavg from Equation 1 can be calculated. Further, when taking Ta as 20°C and hc as 0.004 - 0.025 kW/m²K, the received heat flux to the vehicle is found with Equation 1, and compared to the results at 1.5 m height obtained with FDS (Table 5). The hc of 0.004 kW/m²K is introduced to have comparable results between FDS and Equation 1, which is the case at 150 m. Off course, due to the fire flow near the ceiling, a change of hc is expected along the length of the tunnel, which explains the difficulty to obtain the same results as found with FDS. From this exercise, two conclusions can be derived: 1) Equation 1 results in values which confirm also for the received radiative heat flux with respect to fire spread the positive contribution of passive fire protection in tunnels in the case of 0m/s, as also found in Figs. 5, 6 & 7 for tenability; 2) the differences found between Equation 1 and FDS should be further studied.
Table 5. Average temperature and calculated heat flux for fire spread at different distances in the tunnel, 0 m/s ventilation rate and 200 MW truck fire, compared to FDS result.
| Unprotected – 0 m/s – 200 MW | Protected – 0 m/s – 200 MW | |||||
| 50 m | 100 m | 150 m | 50 m | 100 m | 50 m | |
| Tavg [°C] | 530 | 300 | 229 | 483 | 294 | 199 |
| q.” (hc = 0.025) | 35.9 | 12.7 | 8.4 | 29.7 | 12.3 | 6.9 |
| q.” (hc = 0.004) | 25.2 | 6.8 | 4.0 | 20.0 | 6.5 | 3.1 |
| FDS (RHFG @ 1.5m) | 13.5 | 3.6 | 2.7 | 62.2 | 8.9 | 3.1 |
Based on the results in this paper, it is not clear in which way passive fire protection can help to prevent fire spread to vehicles. It is a topic for further study. Nonetheless, fire spread is a complex phenomenon as for the studied heavy fire, oxygen depletion is most likely to occur in the vicinity of the fire and over a certain distance [9]. A phenomenon that has not been taken into account accurately in the FDS models used in this paper. On the other hand, the present study does confirm the severe effect of ventilation on the fire propagation in tunnels, as reported by [9]. Bearing this in mind, the study already suggest that the use of passive fire protection on the risk of fire spread could be expected to be rather of second order. What can be expected is that in case of ventilation-controlled fires, the combustion and excess fuel zone lengths are proportional to the forced ventilation rate and provided there is enough combustible material available, the fire will propagate at a constant speed [9].
7. Conclusions
- A clear difference is found between 6 MW and 200 MW fire. In view of the study, it is interesting to evaluate also an intermediate scenario, such as a bus fire of 30 MW.
- The use of forced ventilation (study case of 3 m/s) dramatically influences the tenability conditions and the fire spread risk downstream of the fire, for both passive fire protected and unprotected tunnels.
- When no ventilation is used, the passive fire protected tunnel has much better life safety possibilities in terms of temperature and visibility, whereas for radiation no significant difference is found. This positive effect is explained by a stratified smoke layer over a longer distance and time for the protected tunnel, induced by a higher temperature of the hot smoke layer. Toxicity is not studied.
- Given above conclusions, forced ventilation could be only an option if downstream evacuation is not a problem. Downstream traffic jams can be a problem.
- A detailed analysis of the risk for fire spread to other vehicles is out of the scope of this paper. Further research should focus on time-dependent calculating (of the material properties and the fire) and modeling of the actual burning process (instead of an imposed HRR-curve).
8. References
[1] Steunpunt Tunnelveiligheid, Bouwdienst Rijkswaterstaat, Project ‘Safety Proef’, Rapportering Brandproeven, Bouwdienst Rijkswaterstaat, Utrecht, 2002, 110 p.
[2] Lemaire A.D., Leur P.H.E. van de, Safety Proef: TNO Metingen Beneluxtunnel, TNO Centrum voor Brandveiligheid, Rijswijk, 2002
[3] Lemaire A.D., Leur P.H.E. van de, Kenyon Y.M., Safety Proef: Evaluatie metingen rook- en warmtegedrag in de Beneluxtunnel (2002-CVB-R05573), TNO Centrum voor Brandveiligheid, Rijswijk, 2002
[4] Hadjisophocleous G.V., Benichou N., Fire Safety Design Guidelines for Federal Buildings, National Research Council Canada
[5] Ingason H., Li Y. Z., Lönnermark A., Tunnel Fire Dynamics, Springer, 2015, 504 p.
[6] Carlotti P., ventilation, dossier pilote des tunnels équipements, section 4.1, Centre d’études des tunnels CETU, 2003, 155 p.
[7] Mulholland G.W., Smoke Production and Properties, in: DiNenno P.J. et al. (eds.), SFPE Handbook of Fire Protection Engineering, 2nd Edition, Chapter 15, section 2, 1995, pp. 2/217-2/227.
[8] Ingason H., Persson B., Prediction of Optical Density using CFD, in: Curtat M. (ed.), Fire Safety Science - Proceedings of the 6th International Symposium, Poitiers, 1999, pp. 817-828.
[9] Beard A., Carvel R., The Handbook of Tunnel Fire Safety, Thomas Telford, London, 2005, 514 p.

Promat Technical Support
Contact our technical support team with your questions on passive fire protection solutions, our products and systems or installation advice...

Technical Documentation
Find the product datasheets, system brochures, Declarations of Performance, installation manuals and other documents you need to get the job done.