Jan Brekelmans, of the TNO Building & Construction Research Centre, and René van den Bosch, of Promat Tunnel Fire Safety, discuss the recent large-scale fire tests carried out at the Runehamar tunnel in western Norway last September.
Within the framework of a Swedish national and European research programme on tunnel safety, UPTUN, comprehensive largescale fire tests were carried out in the abandoned Runehamar road tunnel, in western Norway, during September 2003. Heavy Goods Vehicle (HGV) fires, similar in size to the recent fires in the Mont Blanc Tunnel (France/Italy) and St Gotthard Tunnel (Switzerland), were simulated by the Swedish National Testing and Research Institute (SP) in collaboration with UPTUN partners: TNO Building & Construction Research of the Netherlands and the Norwegian Fire Research Laboratory (SINTEF/NBL).
Fires in European tunnels over recent years have clearly shown the risks and consequences of fires in large vehicles. Nevertheless, current knowledge of the growth and spread of fires in articulated lorries is still very limited. Recent fires in the Eurotunnel (1995), the Mont Blanc tunnel (1999), the Tauern tunnel (1999) and the St Gotthard tunnel (2001) demonstrated very high energy release rates (150MW-600MW), involving a dozen or more vehicles. Besides the loss of life, destruction of vehicles and tunnel equipment in these fires, the tunnels themselves were severely damaged by the intensive heat. Due to this, the tunnels were out of service for long periods of time, causing significant economic loss to the surrounding area.
There is still a huge gap between the outcome of real fires and small-scale tests. The need for more detailed knowledge on how and why various HGV cargos burn so strongly, and why they spread so quickly, is clear. High heat exposure to the tunnel lining also needs more research. The only way of finding answers to these questions is to carry out systematic large-scale experiments, which can provide a better basis for the design of technical systems for tunnels.
The recent tunnel fires have also highlighted problems facing fire and rescue services: they have not been able to reach the fires due to extreme heat and dense smoke. Discussions after these accidents have included consideration of equipping fire and rescue services with mobile fans, which can drive the smoke in a particular direction, in order to assist their work. However, this in turn requires improved knowledge of the effects of such fans. What is the effect on the fire of increasing the ventilation? What is the effect on the spread of fire between vehicles? These questions were also addressed in the Runehamar tests, especially the effects of radiation in the vicinity of the fire, on their ability to approach and fight the fire.
Preparation of the tunnel
The Runehamar tunnel had to be protected with high temperature resistant materials due to the expected high thermal output of the fire tests. For this task the Runehamar Tunnel Consortium selected Promat’s PROMATECT®-T panels, a calcium silicate-aluminate fire protection board.
The effects of the intended fire loads on the Heat Release Rate (HRR) and the time temperature curve were unknown prior to the actual tests. Therefore TNO advised fire testing to the Dutch RWS fire curve. This RWS fire curve is still seen as one of the most severe hydrocarbon fires, due to its rapid temperature rise in the first five minutes, creating a thermal shock to the tunnel lining and reaching a temperature of 1350°C. The fire protection panels were required to withstand all four fire tests planned at Runehamar, with maximum temperatures of up to approximately 1400°C. The temperature criteria on the rock structure of the tunnel was set at 250°C, which was perceived to be a safe temperature for the rock material in order to minimise damage. The fire protection system was not to show any integrity failure during the four tests. This was applicable to the PROMATECT®-T panels and also the sub-frame including the fixation materials, supplied and installed by Gerco Beveiligingen. Following a series of in-house prequalification tests carried out in order to guarantee this high level of integrity, Promat and Gerco constructed the Runehamar fire protection panels using two thinner panels (20mm and 25mm), glued together with intermediate reinforcement.
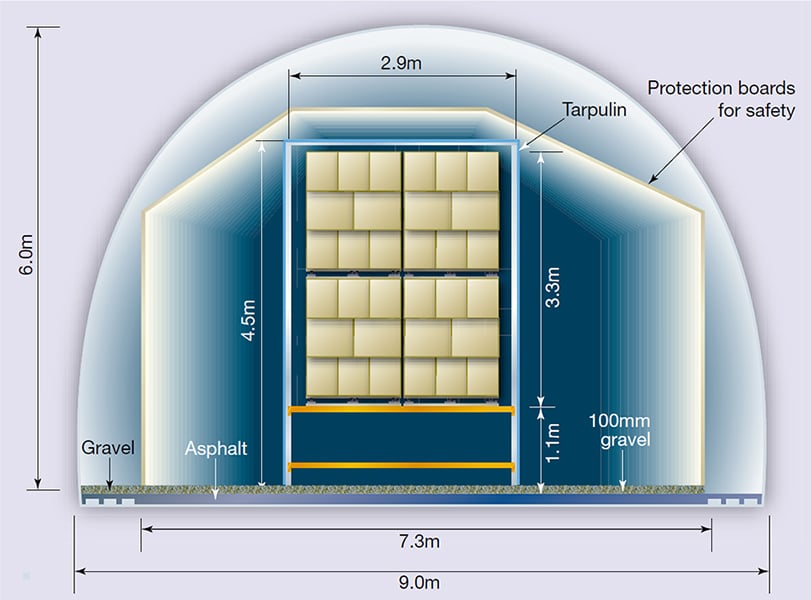
Figure 1 - Cross section of the tunnel at the articulated lorry set-up
The tunnel width varies from 8.17m to 9.40m with a lowest height of 6.39m in the region identified for the fire location. To determine the ideal location and geometry for the tests, 2400 positions within the tunnel were measured. For ease of installation a light steel structure was chosen as the support framework for the fire protection boards.
Within 10 weeks, a 16t steel structure with 30t of fire protection board was installed in the Runehamar tunnel. The length of the thermal isolation zone was 75m. Ceramic curtains were also installed on sections of the tunnel walls at each end of the fire protection structure.
Commodities used as fuel in the four tests
| Test | Description of the fire load | Target | Weight of fire load (kg) | Calorific energy (GJ) | Mass ratio of plastic |
| 1 | 360 wood pallets (1200x800x150mm), 20 wood pallets (1200x1000x150mm) and 74 PE plastic pallets (1200x800x150mm) | 32 wood pallets and 6 PE pallets | 10911 | 240 | 18% |
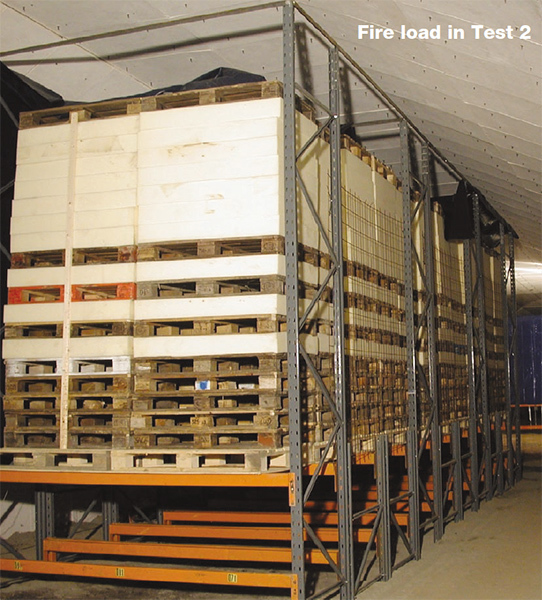
| 2 | 216 wood pallets and 240 PUR mattresses (1200x800x150mm) | 20 wood pallets and 20 mattresses | 6853 | 129 | 18% |
| 3 | Furniture and fixtures (tightly packed plastic and wood cabinet doors, upholstered sofas, stuffed animals, plastic potted plant, wood and plastic toys) and 10 large rubber tyres (800kg) | Upholstered sofa and arm rest | 8500 | 152 | 18% (tyres excluded) |
| 4 | 600 paper cartons with interiors (600x400x500mm) and 15% of total mass of un-expanded polystyrene cups (18000 cups), 40 wood pallets (1200x1000x150mm) | 4 wood pallets and 40 cartons with PS | 3120 | 67 | 19% |
Large scale Runehamar tests
In total four fire tests were performed using a mocked-up HGV (Figure 1). In three tests mixtures of different cellulose and plastic materials were used, and in one test a “real” commodity, consisting of furniture and fixtures, was used. In all tests the mass ratio was approximately 80% cellulose and 20% plastic (Table 1). A polyester tarpaulin covered the cargo. The reason for using furniture in one of the tests was to provide a comparison to a past test (EUREKA 499), which was carried out with similar materials and a very high ventilation rate of 6m/s at the start of the test. This provided a good point of reference between the data from Runehamar and the EUREKA tests.
The fire was located 560m from the west entrance and the wind direction in the tunnel was from east to west. At a distance of 15m from the downstream side of the test commodity there was a fire target consisting of the first row of the same test commodity used in the actual test. This target was used to investigate fire spread to other vehicles. Temperatures were measured by thermocouple arrays.
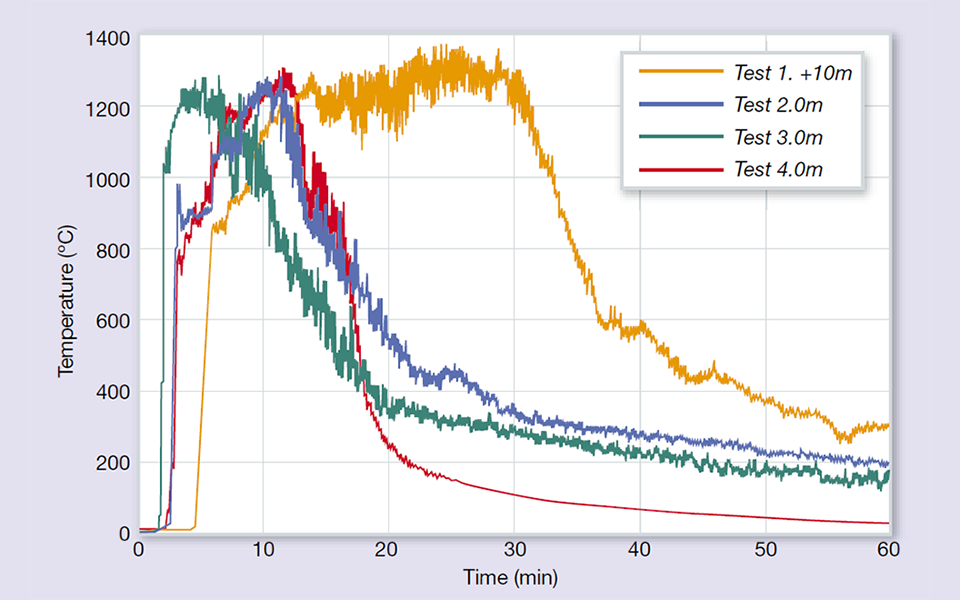
Figure 2 – Gas temperatures
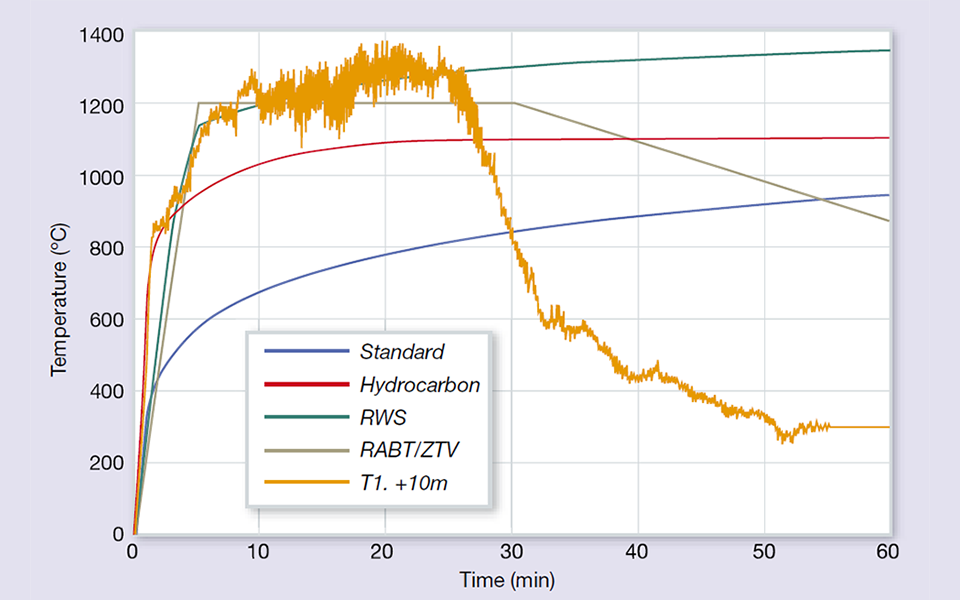
Figure 3 – Gas temperatures in Test 1 compared to standard fire curves
Gas temperatures
The four commodities used in the tests were chosen to give different fire development and maximum Heat Release Rates. Test 1 with wooden and plastic pallets had the highest total energy content and gave the highest maximum Heat Release Rate. The large amount of combustible material also gave a longer period of elevated gas temperatures, with the highest maximum temperature of 1365°C.
In Figure 3 the gas temperature near the ceiling in Test 1 (10m downstream of the fire) is compared to four different standard fire curves. It can be seen that the increase in gas temperature in the test with wooden and plastic pallets is very rapid and closely follows the hydrocarbon-curve for about three minutes. Then the temperature increases even further, more rapidly than the hydrocarbon-curve, and instead follows the RWS curve, again almost exactly, with exceptions for the fast time variations and for a period around 20 minutes after ignition where the measured temperature is higher than the RWS curve.
The RWS curve was developed assuming a 50m³ tanker fire with petrol or fuel oil lasting for 120 minutes and giving a Heat Release Rate of 300MW. The Heat Release Rate in the tests in the Runehamar tunnel did not reach 300MW, but still the temperature followed the RWS curve very well. In test 4 only 3120kg of cardboard boxes and polystyrene cups were used, potentially creating the lowest calorific energy output of all tests. However, temperatures were recorded at the same magnitude of Test 1, although for a shorter period of time.
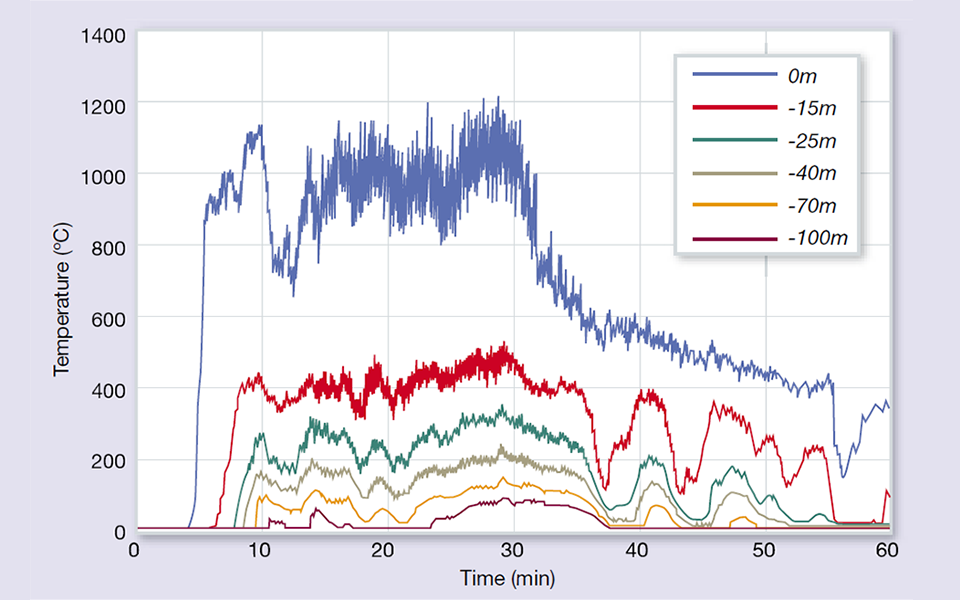
Figure 4 - Temperatures upstream of the fire during Test 1
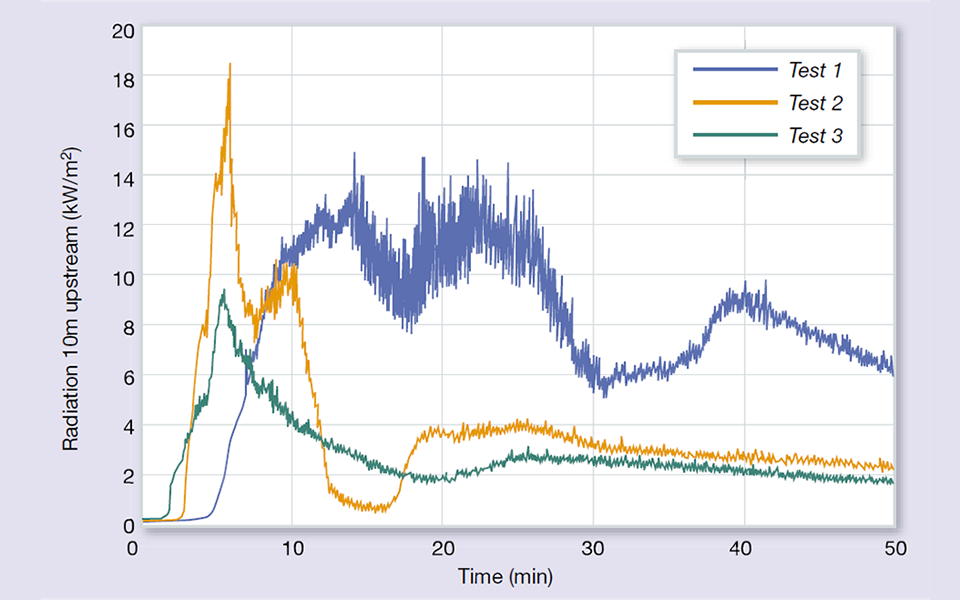
Figure 5 - Radiation 10m upstream of the HGV setup
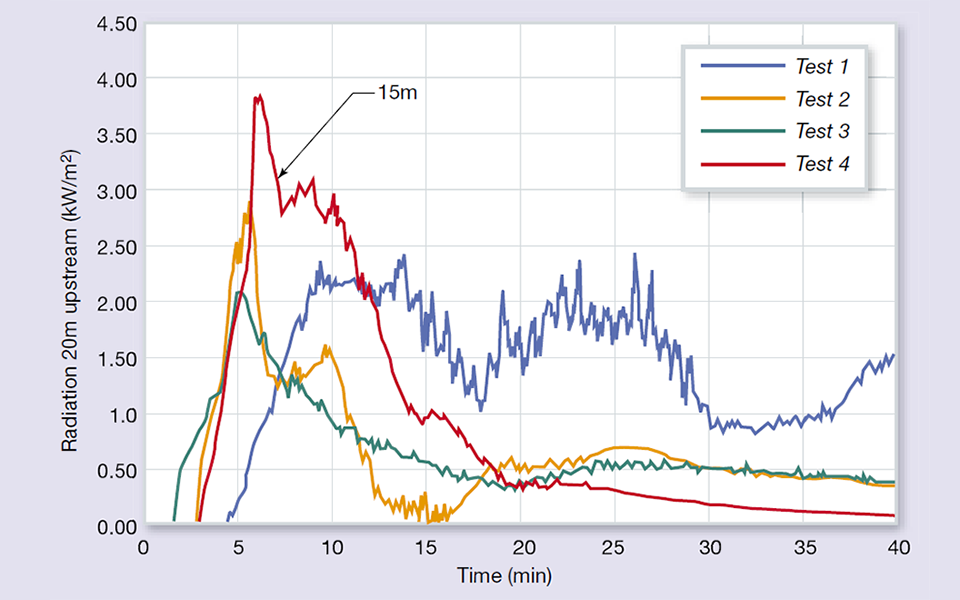
Figure 6 - Radiation 20m upstream of the HGV setup
Thermal protection and spalling
The ceiling of the 75m long test zone was protected by the fire protection panels, with a further 25m of the tunnel wall (near the fire) also protected by the boards. Downstream of the board walls, ceramic curtains were employed to protect the rock, mainly to minimise the flow of hot gases above the panel ceiling. Such hot gases could otherwise affect the rock ceiling and the fire protection panels’ steel support structure. Upstream of the board walls, a 9m distance was also protected with ceramic curtains, although not all the way down to the road. This was carried out in order to keep the backlayering gases below the protective ceiling.
It was obvious that this protection was needed during and after the first test, when large blocks of rock fell down onto the road both upstream and downstream of the protection zone. Downstream, the tunnel ceiling was affected almost all the way to the western portal. The upstream spalling resulted from back-layering taking place, in spite of mobile ventilation units (2-3m/s) that were in use. This back-layering was caused by the fact that the air velocity of the fans decreased when the fire intensity grew, increasing the pressure drop over the fire field.
The results can be seen in Figure 4 where the temperatures upstream of the fire during Test 1 are presented. It can be seen that 40m upstream, the temperature is well above 100ºC for a long time period, and as far away as 100m upstream the temperature is close to 100°C.
Radiation levels near the fire
High temperatures give rise to high radiation, which affects the spread of fire to other vehicles. Another important issue regarding radiation is how close fire fighters can advance. Tests performed with fire fighters in protective clothing indicated a limit, approximately 5kW/m² exposure, above which the fire fighters have difficulty working and also feel pain after about five minutes. Measurements during the tests, presented in Figure 5, show that this limit was exceeded in all four tests at a distance of 10m upstream from the set-up. The radiation level 20m upstream of the fire is an important indicator in determining whether the fire brigade can reach the fire with their water jets. Figure 6 shows the measured heat fluxes at this distance. It appears that all heat fluxes remain below the critical level of 5kW/m². The fire brigade were therefore able to approach the fire up to 20m and attack the fire. However, 20m upstream, in the area where the rock was not protected against the fire, at 80°C-100°C, spalling rock was recorded, resulting in large blocks falling in the area where the fire brigade would be expected to work. This would endanger the fire fighters and hamper their ability to work.
Near fire radiation levels and risk of fire spread
The critical level for fire spread is 12.5kW/m². In Test 1 heat fluxes on the floor of 250kW/m2 occur during 15 minutes. In the same test, peak values of 200kW/m² and average values of about 120kW/m² on the walls were observed. At a distance of 5m downstream the heat flux was still 50kW/m². In all tests the critical level for fire spread was exceeded 5m downstream of the fire. The risk of fire spread to a vehicle at that location therefore existed in all tests, but for different lengths of time. In Test 1 the risk existed for 55 minutes. In the other, less severe, tests shorter durations of about 7-10 minutes occurred. More accurate estimations of the risk of fire spread in a HGV fire are planned for the near future, using sophisticated radiation models.
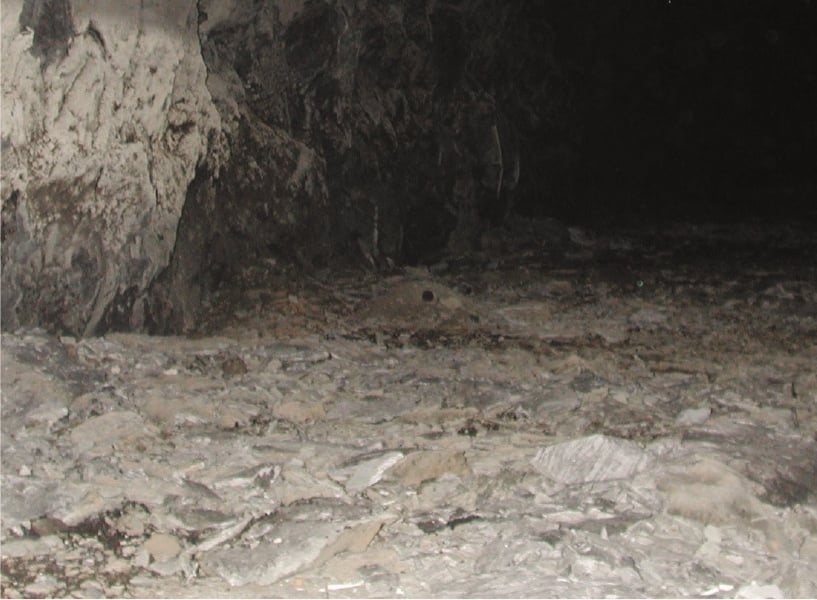
Spalling rocks downstream of the test zone
Conclusions and recommendations
The four large-scale fire tests simulating cargo fires in articulated lorries included varying types and amounts of combustible materials, but all four combustible mixtures showed a very fast increase in temperature after an initial delay. The heat flux measurements indicated difficulties in the fire fighters coming close enough to the fire to be able to fight it. Without back-layering it may be possible to fight the fire at 20m distance with water jets. Peak HRRs in the range of 71MW- 203MW (average) were measured. The time taken to reach the peak HRR was found to be in the range of 8-18,5 minutes from ignition.
In two of the large-scale tests (Test 1 and Test 2) pulsation of the fire and smoke upstream of the fire were observed during a period when the fire was larger than approximately 130MW. The fire growth rate in the range of 5MW to 100MW (70MW in Test 4) was linear for all the tests.
In all tests the fire spread rapidly: within 5-10 minutes the whole cargo was on fire. A first attempt to estimate the fire spread was partly successful for tests 1 and 3. In Test 1, there was a great risk of fire spread to other vehicles at a distance of 5m behind (upstream) the burning cargo for a period of 55 minutes. This risk also existed in the other tests, but for shorter durations. An attempt was made to correlate the heat flux to the wall with the intensity of the fire, but more sophisticated modelling is required. In all tests the thermal load on the wall exceeds the standard ISO-834 temperature curve for building materials for a duration of 15-30 minutes. Other fire curves seem more appropriate in representing the thermal load on the wall during these periods, e.g. the hydrocarbon Euro code 1 curve. It should be noted that all measurements were taken 1m above road level.
Presently tunnel walls are often left unprotected, the tests clearly illustrate the necessity of a fire protective lining for wall applications. Back-layering of heat and smoke was registered both visually and using temperature measurements. The observed air velocity at which back-layering occurred was in good agreement with the values predicted.
The work presented would not have been possible without the efforts of the UPTUN partners (especially SP, NBL and TNO), the Swedish Road Administration, the Norwegian Road Administration, the Swedish Rescue Services Agency, the Swedish Fire Research Board, The Directorate General Research of the EC and the industrial partners (GERCO Beveiligingen and Promat International).

Promat Technical Support
Contact our technical support team with your questions on passive fire protection solutions, our products and systems or installation advice...

Technical Documentation
Find the product datasheets, system brochures, Declarations of Performance, installation manuals and other documents you need to get the job done.