
For each building space, fire curves can be designed that indicate the temperature dependency over time. Such curves are a useful tool for designing fire safety in buildings. During testing, the building elements are exposed to a heat load, which is determined by the standard fire curve. They show the time dependence of the temperature in the fire after the analysis of thermal energy (the difference between ΔHc and thermal losses). The heat losses occur:
- on walls and objects in the room,
- due to heating of air masses,
- due to radiation and convection through windows and doors.
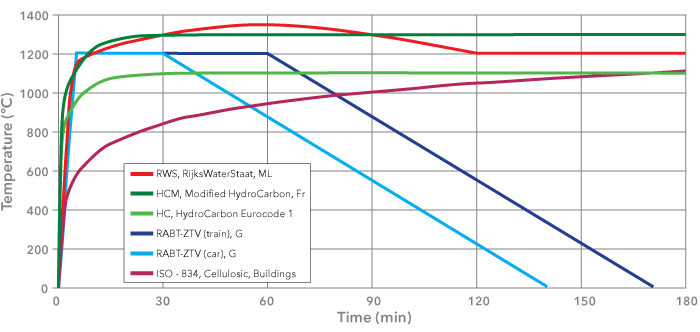
In recent years a great deal of research has taken place internationally to ascertain the types of fire which could occur in the built environment. As a consequence of the data obtained from these tests, a series of time/temperature curves for the various exposures have been developed, as detailed below.
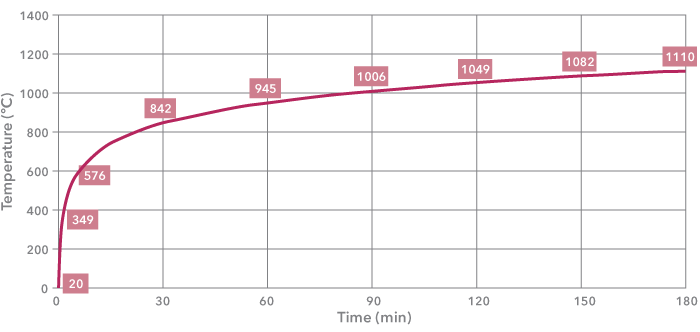
Cellulosic curve
Standard fire tests to which specimens of constructions are subject to are based on the use of the Cellulosic time/temperature curve, as defined in various national standards, e.g. ISO 834, BS 476: part 20, DIN 4102, AS 1530, etc.
This curve is based on the burning rate of the materials found in general building materials and contents.
The temperature development of the Cellulosic fire curve (ISO-834) is described by the following equation: T = 20 + 345 * LOG (8 * t + 1).
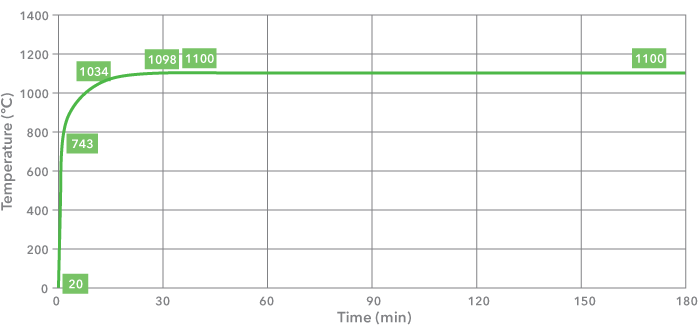
Hydrocarbon curve
Although the Cellulosic curve has been in use for many years, it soon became apparent that the burning rates for certain materials e.g. petrol gas, chemicals, etc, were well in excess of the rate at which, for instance, timber would burn. As such, there was a need for an alternative approach for the purpose of carrying out tests on structures and materials used within the petrochemical industry, and thus the Hydrocarbon curve was developed.
The Hydrocarbon curve is applicable where small petroleum fires might occur, i.e. car fuel tanks, petrol or oil tankers, certain chemical tankers, etc. In fact, although the Hydrocarbon curve is based on a standardized type of fire, there are numerous types of fire associated with petrochemical fuels.
The temperature development of the Hydrocarbon (HC) fire curve is described by the following equation: T = 20 + 1080 * (1 - 0,325 * e - 0,167 * t - 0,675 * e-2,5 * t).
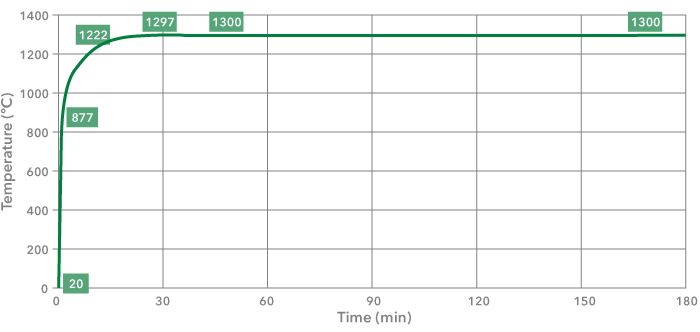
Modified Hydrocarbon curve
Derived from the above-mentioned Hydrocarbon curve, the French regulation asks for an increased version of this known as the Modified Hydrocarbon curve (HCM).
The maximum temperature of the HCM curve is 1300°C, instead of the 1100°C used with the standard HC curve.
However, the temperature gradient in the first few minutes of an HCM fire is as severe as in all hydrocarbon-based fires (RWS, HCM, HC), possibly causing a temperature shock to the surrounding concrete structure and concrete spalling as a result of this.
The temperature development of the HCM fire curve is described by the following equation: T = 20 + 1280 * (1 - 0,325 * e-0,167 * t - 0,675 * e-2,5 * t).
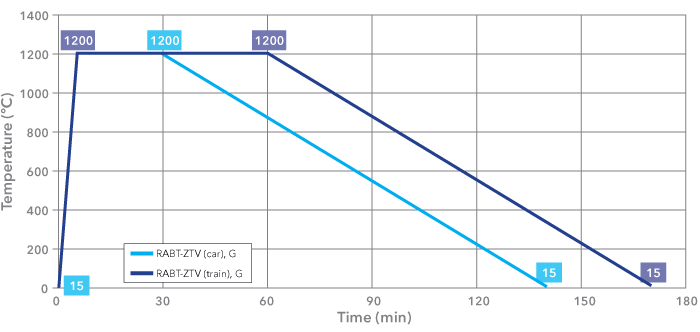
RABT ZTV curves
The RABT curves were developed in Germany as a result of a series of test programmes, such as the Eureka project. In the RABT ZTV curves the rise in temperature is very rapid, up to 1200°C within 5 minutes. However, the duration of 1200°C exposure is shorter than in other curves. with the temperature drop off starting to occur at 30 minutes for car fires. The drop off for train fires only starts at 60 minutes. A 110-minute cooling period is applied to both fire curves.
The failure criterion for specimens exposed to the RABT-ZTV time/temperature curve is that the temperature of the reinforcement should not exceed 300°C. There is no requirement for a maximum interface temperature.
The temperature development of the RABT-ZTV fire curve(s) is described by the following values:
| RABT-ZTV (train) | |
| Time (min) | Temperature (°C) |
| 0 | 15 |
| 5 | 1200 |
| 60 | 1200 |
| 170 | 15 |
| RABT-ZTV (car) | |
| Time (min) | Temperature (°C) |
| 0 | 15 |
| 5 | 1200 |
| 30 | 1200 |
| 140 | 15 |
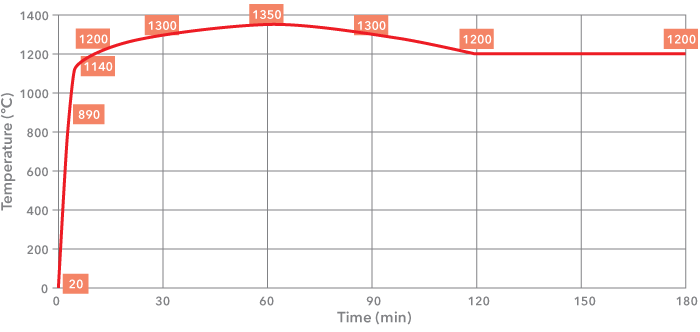
RWS (Rijkswaterstaat) curve
The RWS curve was developed by the Rijkswaterstaat, Ministry of Transport in the Netherlands. This curve is based on the assumption that in a worst-case scenario a 50 m³ fuel, oil or petrol tanker fire with a fire load of 300MW could occur, lasting up to 120 minutes. The RWS curve was based on the results of testing carried out by TNO in the Netherlands in 1979.
The accuracy of the RWS fire curve as a design fire curve for road tunnels was reconfirmed in the full-scale tests carried out in the Runehamar tunnel in Norway.
The temperature development of the RWS fire curve is described by the following values:
| RWS, Rijkswaterstaat | |
| Time (min) | Temperature (°C) |
| 0 | 20 |
| 3 | 890 |
| 5 | 1140 |
| 10 | 1200 |
| 30 | 1300 |
| 60 | 1350 |
| 90 | 1300 |
| 120 | 1200 |
| 180 | 1200 |

Assistance technique
Notre Technical Excellence Centre est prêt à répondre à toutes vos questions techniques, élaborer des solutions en matière de protection passive contre l'incendie, donner des conseils d'installation, etc.

Documentation technique
Trouvez toutes les feuilles produit et système, déclarations de performance, guides d'installation, manuels, etc. nécessaires pour être à la hauteur de la tâche.