Promat Technical Support
Contact our technical support team with your questions on passive fire protection solutions, our products and systems or installation advice...
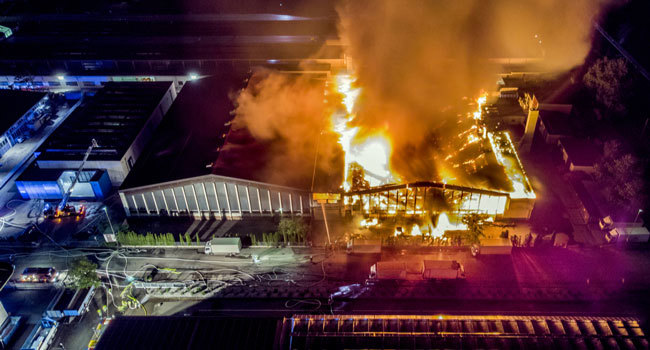
Fire is the chemical reaction of a combustible material with oxygen under the influence of heat. When the chemical reaction produces sufficient heat, it will trigger a chain reaction that continues as long as combustible materials and oxygen are available.
With this basic understanding of fire chemistry, it is clear that in reality no two fires are the same. The type, quantity and distribution of combustible materials is specific for any given situation. A fire can start in many locations because of a variety of possible ignition sources (e.g., a short circuit in an electrical device).
Also, the availability of oxygen is influenced by many factors, such as doors (opened or closed), windows (opened, closed or maybe broken because of the heat) and mechanical ventilation systems. And finally, part of the heat of a fire may be dissipated by the surrounding structure (walls and ceiling) and energy may be lost because of the escape of smoke and hot air through openings.
In short, every fire is unique. Nevertheless, it is impossible to test and evaluate the performance of each fire protection product against the infinity of possible time- temperature curves. For this reason, standardisation of fire tests has taken place since the very start of fire testing in the early 1900s.
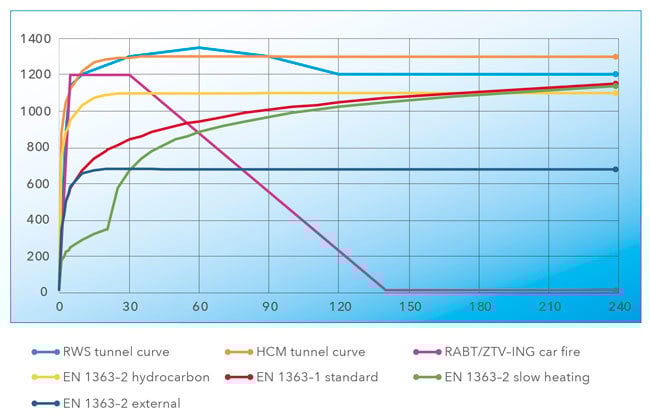
The standardisation resulted in so-called nominal fire curves. These curves describe a relationship between the temperature and the time. One assumption is that the temperature is uniform in the whole compartment, which is typically the case in a fully developed fire. The other assumption is that the time/temperature relation is conservative for a certain range of practical situations, taking also into consideration that most nominal curves constantly grow without any cooling phase.
Standard fire curve
The oldest fire curve is the standard fire curve. It represents a fire in a building compartment. It is sometimes also referred to as the cellulosic curve, even if in reality combustible materials in buildings may be of many types besides cellulosic material. The curve represents the fire in its ‘post flash over’ phase, that is, in its phase of full development. The standard fire curve is defined in various national standards across the globe, e.g., ISO 834, EN 1363-1, BS 476: part 20, DIN 4102 and AS 1530. (In the North American standards ASTM E119 and UL263, a slightly different standard fire curve is used.) The standard fire curve is used for testing and classification of passive fire protection systems for buildings, for example, fire protection of loadbearing structures, compartmentation and fire stopping.
In specific cases, other fire curves may also be required for buildings, in particular, the external fire exposure curve, the slow heating curve and in some cases the hydrocarbon fire curve. These alternative fire curves are described in EN 1363-2.
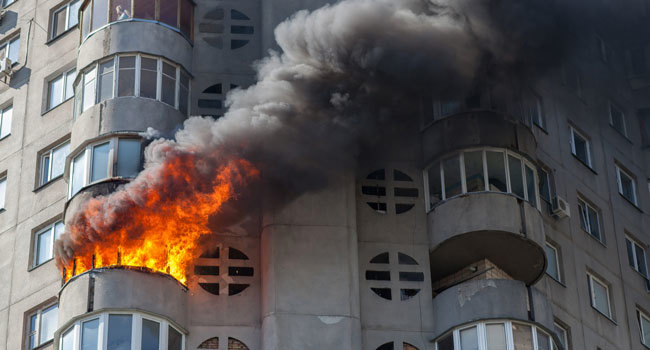
External fire exposure curve
When a fire occurs in a compartment at the perimeter of the building, flames may protrude through openings in the façade. Those flames may have sufficient length to heat the exterior of the building of the floor(s) above the fire compartment. When the exterior of the building should provide fire resistance to avoid the fire coming back into the building on the next floor, the external fire curve is used. This curve considers that the flames are cooled by the presence of air outside the building.
Slow heating curve
Any real fire will always have a certain development phase, where the fire is localised around its place of ignition and where the temperature inside the compartment is still relatively low. At some point in time, flash-over will occur, which means that all combustible materials in the compartment start to contribute to the fire. However, the phase before flash-over can take considerable time, especially if there is a lack of oxygen supply. In such a case, during a long period of time the temperature rises only slowly. For reactive materials such as intumescent paints, the fire protection performance depends on their activation by thermal energy. Potentially, a slowly developing fire or smouldering fire may hamper the correct reaction of the material. In order to check that reactive products such as intumescent paints perform also under slow heating conditions, it is recommended that a slow heating test be done in addition to tests with the standard fire curve.
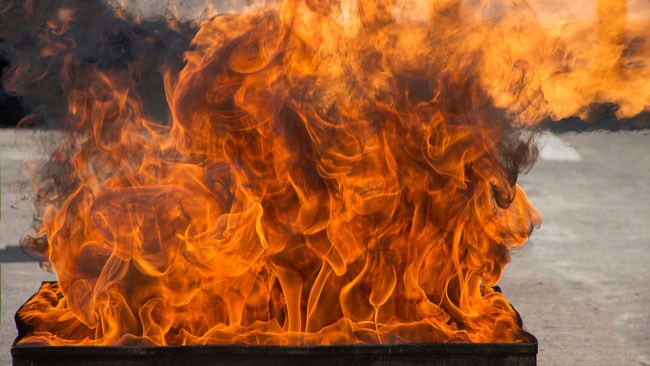
Hydrocarbon curve (liquid pool fires)
In the case where liquid fuel such as gasoline leaks out of a tank and forms a pool on the floor that catches fire, temperatures rise quickly to approximately 1.100°C. This is represented by the hydrocarbon (HC) fire curve. This is the case in industrial situations, e.g., at refineries, but similar fires may also occur in buildings, for example, in the case of storage of highly combustible materials.
Tunnel fires
In tunnels, the fire development is completely different from that of a compartment fire. Because of the confined space, ventilation conditions and significant amounts of combustible materials that are present in vehicles, the fire develops extremely fast and reaches very high temperatures. Typically, a tunnel fire reaches temperatures of over 1.000 ºC in just three to five minutes, and maximum temperatures can go up to 1.350 ºC. For the fire protection material, this is a severe design scenario since many fire protection products are deteriorated or even melt well below 1.350 ºC. Fire protection materials for tunnels need to be resistant against these exceptional heating rates and maximum temperatures.
The most common (and the most severe) fire curve used for tunnels is the RWS fire curve, which was developed by the Dutch Ministry of Transport in the 1980s and is nowadays used in many countries across the globe, including in internationally used standards such as NFPA 502 and ASTM E3134. Furthermore, French regulations employ the HCM fire curve, and German regulations the RABT fire curve.
Natural fire curves
Modern technologies allow calculating natural fire curves, which can define the time-temperatures evolution within a compartment based on its real morphological and geometric characteristics, the amount of and the heat release rate of combustible materials, the amount of oxygen, the presence of active protection and numerous other parameters. These curves, by definition, are not ‘standard’ and correspond only to a specific scenario, in a specific compartment, for the whole duration of the fire (i.e., also including the cooling part). If you require any information about fire protection in combination with natural fire curves, contact your Promat technical expert.
Contact our technical support team with your questions on passive fire protection solutions, our products and systems or installation advice...
Find the product datasheets, system brochures, Declarations of Performance, installation manuals and other documents you need to get the job done.